

In this article, I am going to discuss the Best AI Model Monitoring Platforms that helps teams to track model performance, detect data and model drift, evaluate AI output, monitor LLM apps, identify production issues and improve reliability. I’ll be breaking down the top platforms based on monitoring capabilities, AI quality metrics, integrations, deployment options, alerting, debugging features, pricing, and practical use cases.
What Is AI Model Monitoring Platforms?
AI model monitoring platforms are tools that continuously monitor the performance, reliability, and behavior of artificial intelligence and standard ML models once they’ve been deployed. They monitor things like accuracy, latency, data quality, model drift, prediction shifts, errors and utilization of resources. For LLM-based apps they can also evaluate quality of response, signals of hallucination, relevancy, toxicity, token usage and costs.
These platforms offer dashboards, alerts, traces and debugging tools that help teams find production problems and understand what’s causing them. They combine performance monitoring with AI quality evaluation to assist organizations in maintaining artificial intelligence systems that are both reliable and measurable.
Key Points
| Platform | Key Point |
|---|---|
| Arize AI | Comprehensive AI observability platform for tracing, evaluating, monitoring, and improving AI agents, LLM applications, and machine learning models in production. |
| Fiddler AI | Enterprise AI observability and security platform that provides monitoring, drift detection, explainability, governance, guardrails, and agent observability. |
| Evidently AI | Open-source framework for evaluating, testing, and monitoring ML models, LLMs, RAG systems, and AI agents with extensive built-in metrics. |
| Langfuse | Open-source LLM observability platform offering tracing, evaluation, monitoring, cost tracking, latency analysis, and application debugging. |
| Weights & Biases Weave | AI application monitoring and evaluation platform that helps developers trace, evaluate, and improve LLM-powered systems. |
| Datadog LLM Observability | Extends Datadog monitoring capabilities with tracing, quality metrics, performance tracking, and production monitoring for AI applications. |
| LangSmith | Developer-focused observability platform from LangChain that provides tracing, testing, evaluation, and monitoring for LLM applications and agents. |
| Azure AI Foundry Observability | Microsoft’s enterprise AI monitoring solution for tracking model quality, safety, performance, and operational metrics across AI deployments. |
| Dynatrace AI Observability | Enterprise-grade observability platform that combines application monitoring with AI model performance and operational insights. |
| Deepchecks | AI validation and monitoring platform focused on model testing, data quality checks, drift detection, and production reliability. |
1. Arize AI
Arize AI is an AI observability and model monitoring platform for traditional machine learning, LLM applications, RAG systems and AI agents. It helps with model performance monitoring, data and prediction drift, tracing, evaluation, experiments and production debugging.
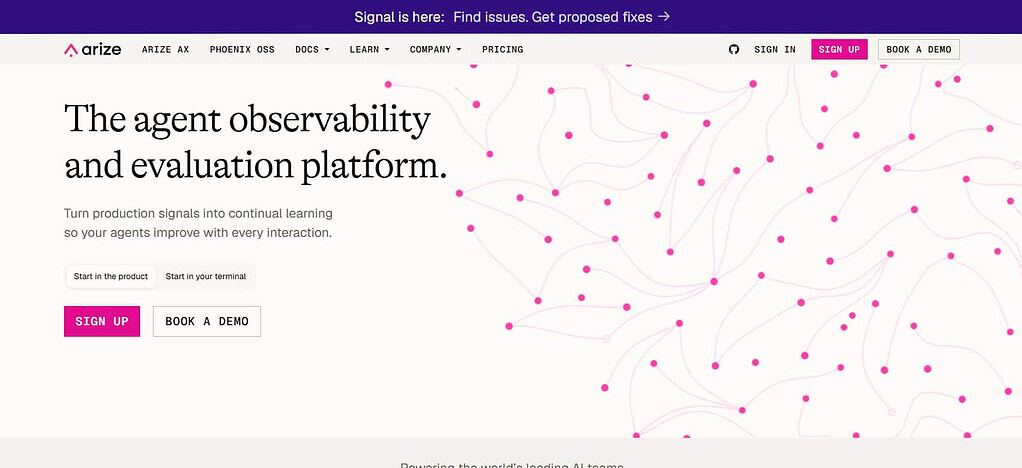
Integrations include OpenTelemetry, OpenInference, leading AI frameworks, cloud environments and machine learning workflows. It can monitor latency, errors, token usage, model behavior and AI quality signals. Alerting and trace-based debugging allow teams to investigate bad runs. Arize AX is available as cloud or enterprise self-hosting and Phoenix is open source.
| Feature | Details |
|---|---|
| AI Observability | Production observability for ML, LLM, RAG, and AI applications |
| Model Monitoring | Tracks model performance, predictions, drift, and production behavior |
| LLM Observability | Tracing and evaluation for LLM applications |
| RAG Monitoring | Helps inspect retrieval quality and generation behavior |
| AI Evaluation | Supports evaluation of model and LLM outputs |
| Tracing | Tracks AI application execution and individual model interactions |
| Drift Detection | Identifies changes in data and model behavior |
| Debugging | Provides trace-level investigation of problematic AI executions |
| Integrations | Supports AI/ML frameworks, OpenTelemetry/OpenInference, and common AI infrastructure |
| Deployment | Cloud and enterprise deployment options |
Arize AI Pros & Cons
Pros
- Supports traditional ML, LLM, RAG & AI Observability
- Strong model performance tracking and drift
- Heavy use of tracing, production debugging
- Support for AI evaluation and quality monitoring
- Compatible with modern AI/ML workflows
Cons
- Sophisticated enterprise features are complex
- Cost can increase with scale of monitoring
- Deep observability configuration and instrumentation
It may take some time for broader features to learn - Some capabilities are better suited for production AI teams
2. Fiddler AI
Fiddler AI is an enterprise AI observability and model monitoring platform that integrates model performance, explainability, risk management, and AI application monitoring. It supports traditional machine learning algorithms and generative AI and agentic applications.
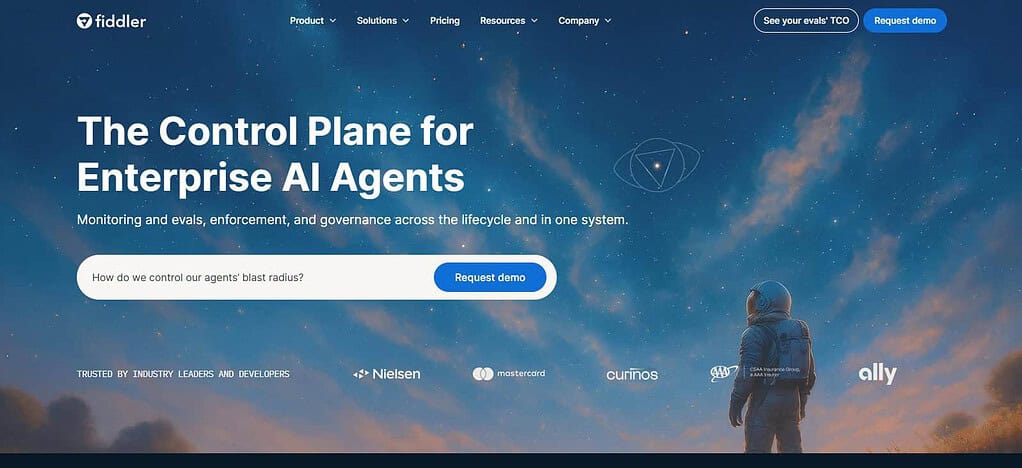
Its monitoring capabilities include model behavior, data quality, drift, performance, LLM outputs, guardrails, and AI risk signals. Designed around enterprise data, ML, cloud and application environments integrations.
Teams can use dashboards, traces, metrics, and alerts to investigate model problems. Deployment is offered via managed and enterprise environments, with governance and security capabilities designed for organizations running AI at scale.
| Feature | Details |
|---|---|
| Model Performance Monitoring | Tracks accuracy, precision, recall, F1, regression, ranking, and other metrics |
| Data Drift | Compares production and baseline data distributions |
| Prediction Drift | Detects changes in model prediction patterns |
| Feature Quality | Identifies missing values, type mismatches, and range violations |
| Unstructured Monitoring | Supports NLP, computer vision, and deep-learning monitoring |
| Explainability | Helps understand model predictions and important contributing factors |
| LLM Monitoring | Provides observability and quality monitoring for generative AI applications |
| Alerting | Real-time alerts can identify model and data problems |
| Debugging | Helps investigate outliers, drift, and contributing inputs |
| Enterprise Monitoring | Centralized monitoring for multiple models and teams |
Fiddler AI Pros & Cons
Pros
- Explainability + Model Monitoring
- Facilitates traditional ML and generative AI monitoring.
- Strong capabilities for data and model drift
- Provides enterprise-class governance features
- Useful for exploring model behavior and performance
Cons
- Might be more than smaller teams need
- Learning curve for advanced monitoring work flows
- Less easy to price for some use cases
- Believed to be best value with wider enterprise adoption
3. Explicit AI
Evidently AI is an open-source artificial intelligence and machine learning monitoring platform that focuses a lot on data quality, model performance, evaluation and drift detection. It can monitor traditional ML models and artificial intelligence systems via dataset, prediction, output, and evaluation result comparisons. It has data drift, prediction drift, data quality checks, model metrics for performance, test suites and evaluation reports.
You can add integrations to Python-based ML pipelines and general MLOps workflows. Teams can run the open-source framework on their own, so it can be flexibly deployed and is useful for customized monitoring environments. Its model is especially suited for teams that want to have control over monitoring infrastructure and metrics.
| Feature | Details |
|---|---|
| Open-Source Monitoring | Provides an open-source framework for AI and ML evaluation |
| Data Quality | Checks missing values, distributions, schema issues, and data integrity |
| Data Drift | Compares datasets to identify statistical changes |
| Prediction Monitoring | Tracks changes in model predictions |
| Model Evaluation | Supports performance evaluation against reference or production data |
| Test Suites | Allows teams to create repeatable automated data and model checks |
| Reports | Generates monitoring and evaluation reports |
| Python Support | Designed for integration with Python-based ML workflows |
| Custom Metrics | Enables customized metrics and evaluation logic |
| Deployment | Can be self-hosted and integrated into existing ML infrastructure |
Explicit AI Pros & Cons
Pros
- Monitoring open source framework
- Robust data quality and drift detection
- Customizable monitoring checks *
- Python friendly for use in machine learning engineering teams
- Can be self-hosted, giving you more control over infrastructure
Cons
- Higher engineering effort than fully managed platforms
- Production infrastructure may need to be retained in house
- Enterprise workflows may require additional setup
- Less focus on full-stack application observability
- Technical knowledge may be needed to customize checks
4. Langfuse
Langfuse is an open-source LLM observability and evaluation platform to monitor LLM applications, RAG pipelines, prompts and AI agents. It offers tracking of individual model calls and application workflows with latency, token usage, costs, inputs, outputs, and evaluation scores.
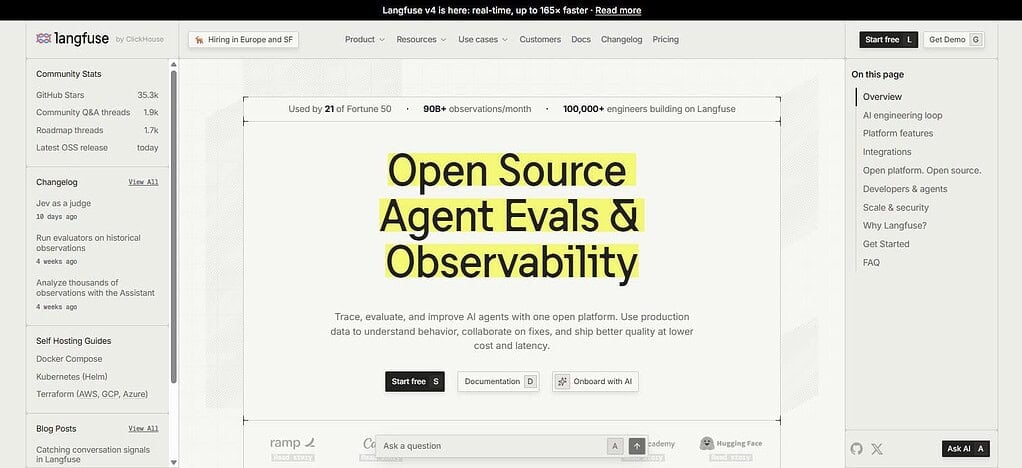
It has integrations with OpenTelemetry, SDKs, popular LLM frameworks and application environments, so it works with most any framework. In a debugging context, failed or low quality generations are explored with detailed traces, sessions, observations and prompt information.
It has deployment options including managed cloud and self-hosting, plus an open source version for infrastructure control. Cloud pricing is measured in units of usage, traces, observations, and scores.
| Feature | Details |
|---|---|
| LLM Observability | Tracks LLM applications from development through production |
| Tracing | Captures LLM calls, retrieval, tools, embeddings, and other application steps |
| Agent Monitoring | Provides visibility into multi-step agent workflows |
| Sessions | Groups multi-turn conversations and agent interactions |
| Evaluation | Supports LLM-as-a-Judge, heuristics, and human evaluation |
| Prompt Management | Provides prompt versioning, testing, and deployment workflows |
| Cost Monitoring | Tracks AI usage and costs |
| Latency Monitoring | Helps identify slow LLM calls and application steps |
| Integrations | Supports SDKs, OpenTelemetry, frameworks, and 100+ integrations |
| Deployment | Available as managed cloud and self-hosted open-source software |
Langfuse Pros & Cons
Pros
- Open-source platform for LLM observability
- Strong tracing for LLMs and agent workflows
- Supports human in the loop and LLM evaluation
- Offers real-time visibility of tokens, latency and cost
- Deployment options (self-hosted or in the cloud)
Cons
- Subject primarily to LLM and AI applications
- Self-hosting is infrastructure management
- Advanced workflows can take a while to set up
It does not focus on traditional ML monitoring - Larger deployments require careful observability planning
5. Weights & Biases Weave
Weights & Biases Weave is an AI observability and evaluation platform that plugs into the wider Weights & Biases ecosystem. It supports LLM apps, generative AI workflows, agents, model experiments and production traces. “Monitoring can capture inputs, outputs, latency, token usage, model calls, application steps and evaluation results, and tracing helps developers explore individual AI runs.

Its integrations are tied to AI development frameworks and the broader W&B ecosystem. Weave is available as a hosted infrastructure and enterprise private deployment. Pricing is based on a free usage quota, with paid plans partly based on usage and data ingestion, so the volume of workloads is a key factor in estimating costs.
| Feature | Details |
|---|---|
| LLM Observability | Monitors generative AI and LLM application behavior |
| Tracing | Records model calls and application execution |
| AI Evaluation | Helps evaluate model and application outputs |
| Experiments | Supports comparison of prompts, models, and application versions |
| Dataset Evaluation | Enables evaluation using curated datasets |
| Prompt Tracking | Tracks prompts and their associated outputs |
| Model Tracking | Connects AI application behavior with model experiments |
| Performance Monitoring | Provides visibility into latency and execution behavior |
| Developer Workflow | Connects observability with the broader W&B ML platform |
| Enterprise Support | Provides hosted and enterprise deployment capabilities |
Weights & Biases Weave Pros & Cons
Pros
- Deep integration with the W&B ecosystem
- Support LLM trace and AI assessment
- Good for experiment and model development workflows
- Offers visibility into AI applications in execution
- Great for teams already using W&B tooling
Cons
- W&B ecosystem takes time to learn *
- Might be more than needed for simple LLM monitoring
- Some advanced features may require extra configuration
- Pricing depends on usage and organization needs
- Additional integrations may be required with third-party teams outside of the W&B ecosystem
6. Datadog LLM Observability
Datadog LLM Observability expands Datadog’s broader application and infrastructure monitoring capabilities to LLM and AI applications. Supports LLM calls, AI agents, application traces, model interactions, latency, errors, token consumption and performance analysis.
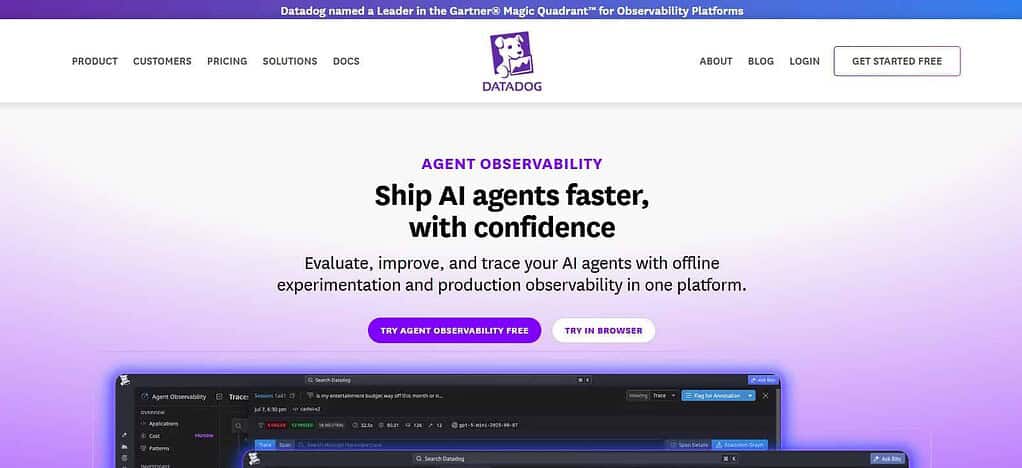
The main advantage is the correlation of AI telemetry with existing application, infrastructure, security and service monitoring. Then, developers are able to analyze traces and individual LLM spans to find failures, slow requests, costly calls, or problematic workflows.
Deployment is mainly governed through Datadog’s SaaS environment with SDK and OpenTelemetry support. Pricing is usage based on LLM spans with paid plans and additional retention considerations for larger production workloads .
| Feature | Details |
|---|---|
| LLM Monitoring | Observes LLM requests and application behavior |
| AI Tracing | Tracks LLM calls and application execution paths |
| Agent Observability | Provides visibility into AI agent workflows and tool calls |
| Token Monitoring | Tracks input, output, and total token consumption |
| Latency Monitoring | Identifies slow model and application requests |
| Error Tracking | Helps detect failed LLM operations and application errors |
| Cost Visibility | Helps teams understand AI usage and model-related spending |
| Application Correlation | Connects AI telemetry with application and infrastructure monitoring |
| OpenTelemetry | Supports standardized telemetry collection |
| Debugging | Allows teams to inspect traces and individual AI operations |
Datadog LLM Observability Pros & Cons
Pros
- Connects LLM monitoring with application observability
- Strong tracing and performance monitoring
- Tracks tokens, latency, errors, and AI operations
- Useful for monitoring AI applications at enterprise scale
- Integrates with broader Datadog infrastructure
Cons
- Most valuable when already using Datadog
- Usage-based costs can grow with telemetry volume
- Configuration can become complex for large environments
- AI-specific monitoring may require additional instrumentation
- Can be more extensive than needed for small AI projects
7 LangSmith
LangSmith is an LLM and AI app dev, evaluation and observability platform, tightly integrated with LangChain and LangGraph apps. It enables LLMs, RAG systems, agents, tool calls, prompts, datasets, and evaluation workflows. Monitoring gives you rich traces on model calls, retrieval, tools, latency, errors, inputs, outputs, and feedback.
Developers are able to use tracing, evaluators, annotation, testing and debugging workflows to find quality problems and to transform production failures to evaluation cases. The deployment can be cloud, hybrid or enterprise self hosted. Pricing includes a free Developer tier and paid plans with seat and trace-based usage considerations, with enterprise pricing tailored.
| Feature | Details |
|---|---|
| LLM Observability | Provides production visibility into LLM applications |
| Tracing | Tracks model calls, tools, retrieval, and application steps |
| Agent Monitoring | Supports tracing of agent and LangGraph workflows |
| RAG Evaluation | Helps evaluate retrieval and generated responses |
| Prompt Management | Enables prompt testing, versioning, and experimentation |
| Dataset Management | Supports datasets for evaluation and testing |
| Automated Evaluation | Allows evaluators to measure AI application quality |
| Human Feedback | Supports human annotation and feedback workflows |
| Debugging | Trace inspection helps identify failures and quality problems |
| Deployment | Cloud, hybrid, and enterprise deployment options |
LangSmith Pros & Cons
Pros
- Strong LLM tracing and debugging
- Excellent support for agent and RAG workflows
- Provides datasets and evaluation capabilities
- Useful prompt testing and experimentation features
- Works closely with LangChain and LangGraph ecosystems
Cons
- Particularly optimized for LLM application development
- Advanced functionality can have a learning curve
- LangChain-focused teams may benefit most
- Large-scale tracing can increase usage costs
- Traditional ML monitoring is outside its primary focus
8. Azure AI Foundry Monitoring
Azure AI Foundry Observability monitors and evaluates the performance of AI applications built in Microsoft’s AI ecosystem (e.g., generative AI and agent-based workloads). It offers insight into application traces, model interaction, performance, token consumption, latency, errors, and evaluation results.
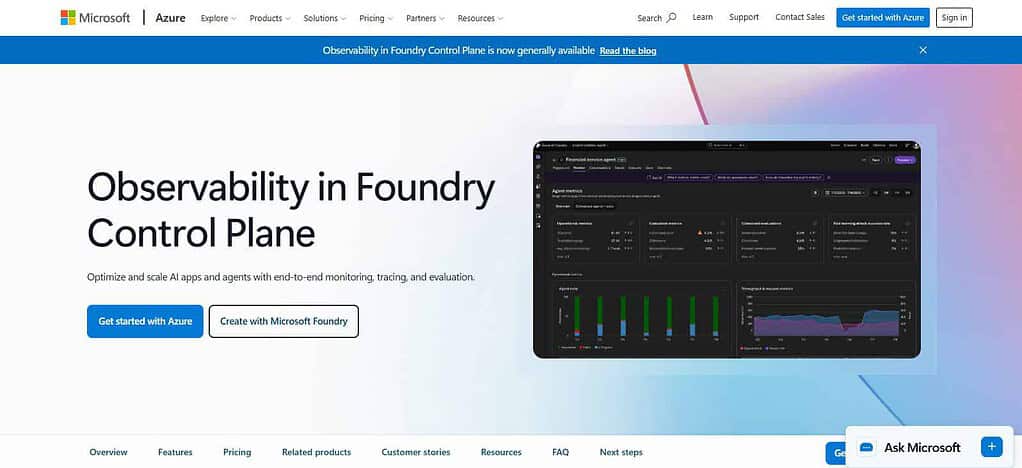
Its ecosystem integrates with Azure services, application monitoring, Microsoft AI tooling and OpenTelemetry-based instrumentation. AI quality monitoring can be used to evaluate both outputs and application behavior along with operational telemetry.
Debugging involves tracking the execution of AI applications and identifying the calls or performance problems that introduce errors. Deployment is focused on Microsoft Azure, so is of particular interest to organizations already running their AI workloads in the Azure ecosystem.
| Feature | Details |
|---|---|
| AI Monitoring | Provides production monitoring for AI applications and agents |
| Distributed Tracing | Captures LLM calls, tool invocations, agent decisions, and dependencies |
| AI Evaluation | Measures quality, safety, reliability, and application behavior |
| RAG Evaluation | Includes groundedness and relevance evaluation |
| Agent Evaluation | Supports tool-call accuracy and task-completion metrics |
| Quality Monitoring | Tracks quality scores alongside operational metrics |
| Token Monitoring | Tracks token consumption |
| Performance Monitoring | Covers latency and error rates |
| Alerting | Alerts can be configured around quality and safety thresholds |
| Integrations | Works with Azure Monitor Application Insights, OpenTelemetry, LangChain, LangGraph, and agent frameworks |
Azure AI Foundry observability Pros & Cons
Pros
- Tight integration with Microsoft Azure AI Services
- Provides AI application & agent observability *
- Enables tracking and assessment
- Works with Azure Monitor and Application Insights
- Good for organizations already in Azure
Cons
- Primarily attractive in the Azure ecosystem
- Azure services are very configurable
- Pricing may include multiple components of Azure services
- Custom monitoring may require Azure knowledge
- Less convenient for teams who want to stay out of cloud-specific ecosystems
9. Dynatrace AI Observability
Dynatrace AI Observability blends AI application monitoring with broader application performance, infrastructure and operational observability. It is designed to monitor generative AI and AI-enabled applications across model interactions, application services, infrastructure, performance and user experience. Monitoring can include AI requests, latency, errors, dependencies, token-related activity and operational behavior, and broader Dynatrace telemetry helps tie AI issues to underlying services.
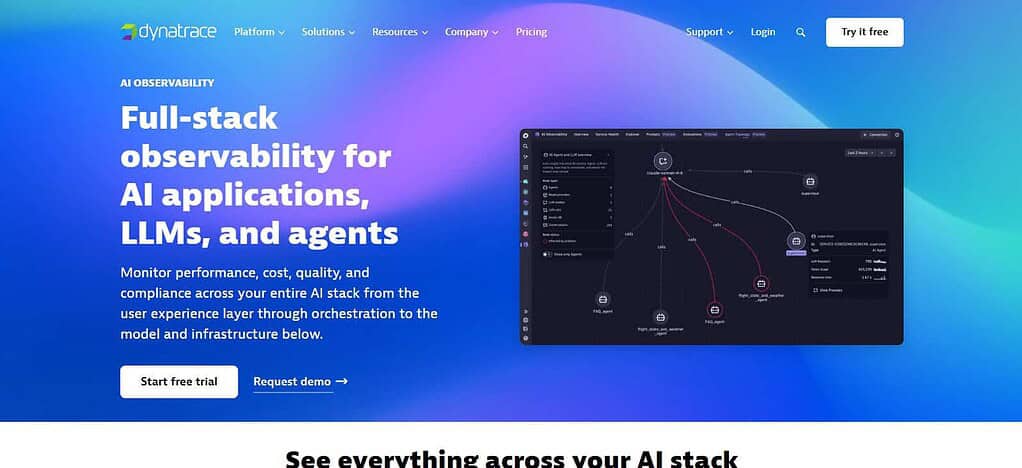
Enterprise deployments supported by integrations across cloud, application, infrastructure, and observability environments. Its alerting and root-cause analysis are core parts of the workflow, enabling teams to investigate issues across interconnected systems. Deployment is mainly enterprise cloud-centric, with observability embedded in larger Dynatrace environments.
| Feature | Details |
|---|---|
| Full-Stack AI Observability | Covers applications, agents, orchestration, models, vector databases, and infrastructure |
| LLM Monitoring | Tracks model calls, latency, tokens, errors, and reliability |
| Agent Monitoring | Visualizes agent execution, tool usage, and interactions |
| AI Evaluation | Supports production LLM-as-a-Judge evaluation |
| Quality Monitoring | Tracks response quality, safety, relevance, and evaluation scores |
| Cost Monitoring | Tracks model and token-related costs |
| Distributed Tracing | Provides detailed traces from applications through AI services |
| Root-Cause Analysis | Connects AI problems with application and infrastructure dependencies |
| Integrations | Supports OpenAI, Anthropic, Gemini, Bedrock, Azure AI Foundry, LangChain, vector databases, and more |
| Infrastructure Monitoring | Monitors GPUs, TPUs, compute resources, and AI infrastructure |
Dynatrace AI Observability Pros & Cons
Pros
- Provides broad full-stack AI observability
- Connects AI monitoring with infrastructure and applications
- Supports LLM and AI agent monitoring
- Strong distributed tracing and root-cause analysis
- Useful for large enterprise environments
Cons
- Broad platform can have a significant learning curve
- May be excessive for smaller AI projects
- Enterprise deployment can require careful configuration
- Pricing can depend on multiple observability factors
- Requires more setup for organizations new to Dynatrace
10 Deepchecks
Deepchecks is an AI & Machine Learning validation and monitoring platform focused on model quality, data quality, and production reliability. It supports traditional ML workflows but also has the ability to evaluate modern AI and LLM applications.
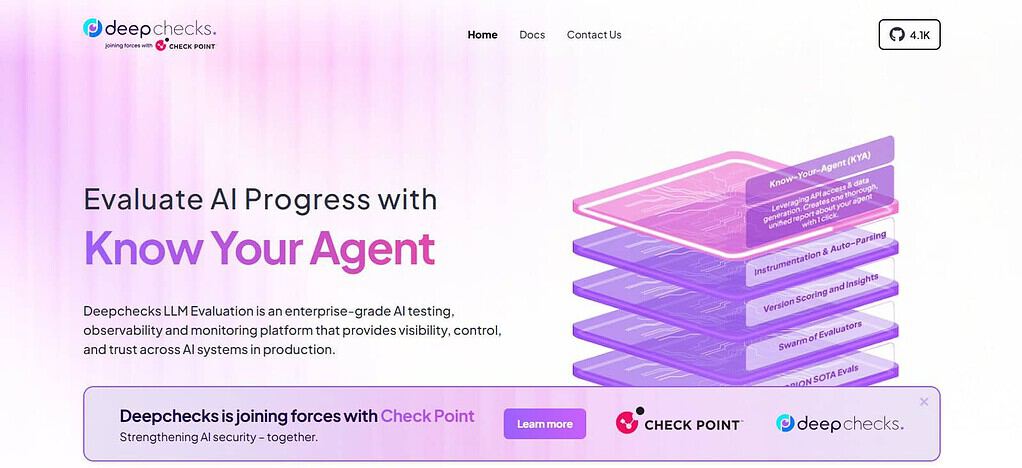
Monitoring can catch issues like data drift, model performance, validation failures, and quality issues across the development and production pipelines. It integrates with Python-based machine learning environments and MLOps pipelines.
Teams can use automated checks, reports, validation results and monitoring workflows to investigate issues with models or data. Deployment can be customized to meet different organizational needs, and commercial options are available for teams that require broader production monitoring and enterprise features.
| Feature | Details |
|---|---|
| ML Monitoring | Monitors deployed machine learning models and their versions |
| Data Monitoring | Tracks changes and issues in production data |
| Model Checks | Runs predefined checks against model and data behavior |
| Drift Detection | Identifies changes in monitored data and model behavior |
| Test Suites | Provides deeper investigation through collections of checks |
| Alert Rules | Generates alerts when configured monitoring conditions are met |
| Model Versions | Tracks multiple versions of models performing the same task |
| Dashboard | Displays monitoring results and changes over time |
| Root-Cause Investigation | Test Suites can investigate detected issues in greater detail |
| Production Monitoring | Designed to continuously monitor deployed ML systems |
Deepchecks Pros & Cons
Pros
- Strong focus on data and ML model quality
- Supports automated model and data checks
- Useful drift and production monitoring capabilities
- Provides detailed validation and testing workflows
- Can fit existing machine learning pipelines
Cons
- More focused on ML quality than full-stack observability
- Advanced monitoring requires technical configuration
- LLM observability is not its only or primary focus
- Teams may need additional tools for infrastructure monitoring
- Larger monitoring environments can require careful setup
Conclusion
Monitoring platforms for AI models have become essential for deploying reliable AI applications in production. The platforms mentioned here are for different monitoring needs like model performance, data and model drift, LLM evaluation, tracing, latency, token usage, data quality and debugging. Arize AI and Fiddler AI offer general AI observability, while Evidently AI is focused on open-source monitoring and evaluation.
Langfuse, LangSmith and Weave are very focused on LLM applications, whereas Datadog, Azure AI Foundry and Dynatrace connect AI monitoring to broader enterprise observability. Deepchecks offers robust data and model validation. The right platform depends on your models, deployment environment, integrations, monitoring needs and budget.
FAQ
What is AI model monitoring?
AI model monitoring is the process of continuously tracking AI systems after deployment to identify performance changes, data drift, errors, latency, quality issues, and unexpected model behavior.
Why is AI model monitoring important?
AI model monitoring helps teams identify production problems early, maintain model quality, understand changing data patterns, troubleshoot failures, and track the reliability of AI applications over time.
What should an AI model monitoring platform track?
A platform can track model performance, data quality, data drift, prediction drift, latency, errors, token usage, costs, LLM outputs, hallucination-related signals, and other AI quality metrics.
Can these platforms monitor LLM applications?
Yes. Platforms such as Arize AI, Langfuse, Weights & Biases Weave, Datadog LLM Observability, and LangSmith provide capabilities for monitoring or evaluating LLM applications, including traces, outputs, latency, and usage.
What is model drift in AI?
Model drift occurs when changes in real-world data or relationships affect how an AI model behaves after deployment. Monitoring tools can help detect changes in input data, predictions, or model performance.