


In this post, I will discuss the How To Create a Pivot Table, a handy tool that turns raw numbers into clear summaries.
Whether youre brand-new to spreadsheets or just want to polish your skills, my easy steps let you set up pivot tables in Excel or Google Sheets so you can blink at big data and understand it fast.
What is a Pivot Table?
A pivot table is a handy feature found in Excel, Google Sheets, and other spreadsheet apps that turns messy numbers into clear summaries. Instead of changing the original data, the tool groups, counts, and totals info so you can see what really matters.
You can drag-and-drop fields to swap rows for columns, letting you look at the same facts from fresh angles in seconds. Because of that flexibility, pivots help everyone-students, business pros, and casual users-discover trends, patterns, and quick insights without deep number-crunching skills.
How To Create a Pivot Table steps by steps
How to Create a Pivot Table in Excel
Step 1: Prepare Your Data
- Put your information in a neat table with clear column headers.
- Don’t leave any empty rows or columns between the data.
Step 2: Select the Data
- Click on any single cell inside the table.
Step 3: Insert the Pivot Table
- Head to the Insert tab and tap PivotTable.
- In the pop-up:
- Check that the range is correct.
- Pick where to show the table; New Worksheet is usually best.
- Hit OK.
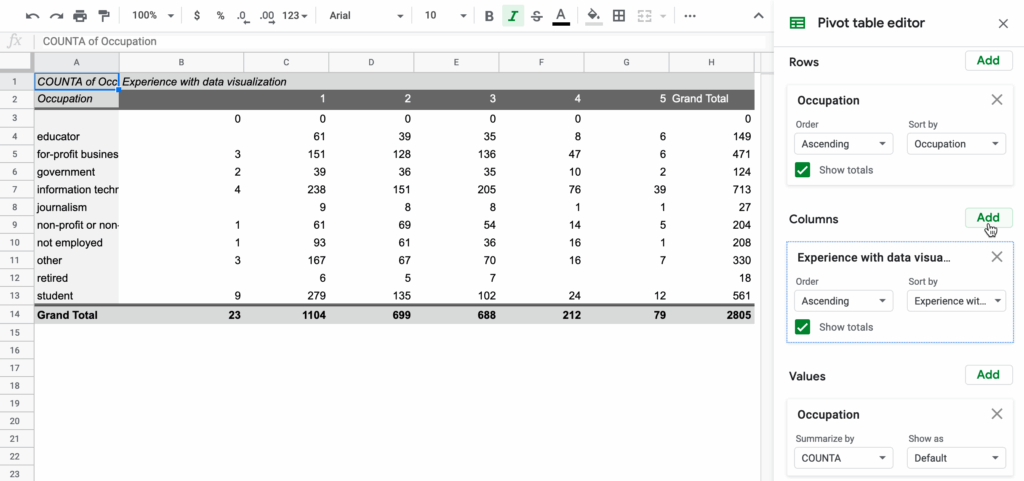
Step 4: Build the Pivot Table
- The PivotTable Fields box opens.
- Drag fields to these spots:
- Rows: Main groups (Region, Product)
- Columns: Side groups (use if needed)
- Values: Numbers to total (Sales, Quantity)
- Filters: Quick filters (Date, etc.)
Step 5: Customize & Analyze
- Right-click a number and pick Value Field Settings to switch Sum to Count, Average, and more.
- Use the Design tab for fresh styles.
- Click the dropdowns to sort and filter the results.
Prerequisites Before Creating a Pivot Table
Before you dive into building a pivot table, make sure your raw data is tidy. Organize everything into a neat table with clear column headers, and ditch any blank rows or empty columns.
Each column should hold one data type only-whether dates, numbers, or text-so the pivot can summarize correctly. Being comfortable with basic Excel or Google Sheets navigation will keep the process quick and simple.
Also, know exactly what question you want to answer; that focus will shape how you set up the table. Spending a few extra minutes on cleaning lets you build error-proof, efficient pivot tables.
Tips for Using Pivot Tables Effectively
Group Your Data
Bundle dates, numbers, or words into clear chunks so answers pop fast.
Use Filters
Apply single-click filters to look at only the part you need; the full set stays in the back.
Sort Results
Sort rows or columns in seconds to push top facts to the front.
Add Calculated Fields
Insert quick formulas right in the pivot so you dont jump between sheets.
Format for Clarity
Bold headers, splash of color, and tidy number styles keep eyes moving.
Refresh Data
Hit refresh after the source changes so every answer stays correct.
Keep Data Consistent
Never mix text, dates, and numbers in one column or formulas will break.
Common Issues and How to Fix Them
Pivot Table Not Updating – When the source data gets new entries yet the table stays frozen, just right-click anywhere on the table and choose Refresh.
Incorrect Data Summaries – Look over your source and make sure every column has the same data type, then double-check that the right aggregation-sum, count, or average-is used in the Values area.
Blank or Missing Data – Blank rows, columns, or cells hiding in the source can throw everything off, so fill or delete them before creating the Pivot Table.
Data Range Errors – Double-check the range you selected; if new rows or columns have been added, it might stop before reaching the last piece of data.
Grouping Issues – Grouping fails when numbers are stored as text or dates are not real date formats, so convert those fields first and try again.
Advanced Pivot Table Features (Optional for Beginners)
Using Slicers: Drag-and-drop buttons let you filter data with a click, no menus needed.
Creating Pivot Charts: Link a chart to the table so trends update as you change the numbers.
Multiple Consolidation Ranges: Pull together data from several sheets or files and summarize it in one spot.
Calculated Fields: Write your own formula inside the table for totals that standard options dont provide.
Grouping Data: Cluster dates, numbers, or labels into neat blocks that make reports easier to scan.
Risk & Management

Risk of Inaccurate Data
The table only mirrors your source. If that sheet has typos or missing numbers, your summary is wrong. Double-check and clean the data first!
Over-Reliance on Pivot Tables
A pivot can hide the story beneath the spreadsheet. Never let it do all the thinking; pair it with questions and simpler tools you understand.
Data Privacy Concerns
Before you pass on a pivot to anyone outside your team, scrub names and sensitive figures. Keep moderation in mind to stop leaks.
Version Compatibility
Excel, Google Sheets, and other apps grow at different speeds. A file that gleams on your laptop may crash or misalign on someone elses screen, so test before you send it around.
Pros & Cons
| Pros | Cons |
|---|---|
| Quickly summarizes large data sets | Can be confusing for beginners initially |
| Allows easy data grouping and filtering | Errors in source data affect results |
| Flexible layout to view data from different angles | Limited functionality for very complex calculations |
| Helps identify trends and patterns | May slow down with extremely large datasets |
| Interactive and easy to update with refresh | Requires clean, well-structured data |
Conclusion
Wrapping things up, making a pivot table is one of the fastest ways to tidy up large amounts of data and see clear answers. If you stick to the easy steps shown earlier, anyone-newbie or pro-can pull out trends and decide smarter.
Just start with clean data, pick the right columns, and tweak the table so it fits your question. The more you practice, the more these tables turn messy numbers into insights you can actually use.