


In this article, I will discuss the best tools to monitor a server. These tools help businesses and IT teams maintain performance, uptime, and reliability.
They monitor servers for CPU, memory, disk, and network health, and provide alerts and real-time insights. Picking the right tools will help with predictive maintenance, resulting in less downtime and more efficient operation of IT assets.
What is Monitor Server?
Server monitoring systems are an essential part of IT tools and software. It actively tracks the performance and availability of servers within the network. It allows IT teams to identify issues before they affect users.
Some issues that monitoring systems track include excessive CPU usage, insufficient memory, network downtime, and memory usage.
It allows IT teams to smooth operations, increase reliability, and predict and prevent unexpected outages. This improves reliability, reduces downtime, and smoothens operations, making it a vital monitoring tool and enhancing IT infrastructure strategies.
Why Use Tools to Monitor a Server
Here are the most important reasons to use tools to monitor servers:
Ensure Uptime & Reliability – Monitoring tools notify you instantly when servers are down. This prevents prolonged downtime and helps maintain business continuity.
Detect Performance Issues Early – These tools monitor CPU, memory, and disk usage over time, so IT teams can resolve issues before they impact end users.
Optimize Resource Usage – Monitoring tools server performance. This helps determine optimal resource allocation, thereby reducing costs and improving overall resource use.
Enhance Security – Some monitoring tools identify abnormal behaviour and possible breaches, thus safeguarding servers from being attacked.
Generate Reports & Insights – Monitoring tools support analytics and report generation to support decision-making, especially when planning future capacity.
Best Tools to Monitor Server Points
- Nagios – Monitors server performance, network health, and alerts for downtime.
- Zabbix – Provides real-time monitoring with metrics collection and visualization.
- Datadog – Cloud-based monitoring for servers, apps, and infrastructure.
- Prometheus – Open-source system monitoring with powerful alerting and metrics.
- Icinga – Tracks server availability, performance, and network issues.
- Checkmk – Enterprise-grade monitoring with dashboards and automated alerts.
- Sensu – Monitors infrastructure with flexible alerting and event processing.
- Better Stack – Simple and modern monitoring with uptime and incident tracking.
- New Relic – Full-stack monitoring with analytics and performance insights.
- Site24x7 – Cloud monitoring platform for servers, networks, and applications.
10 Best Tools to Monitor a Server
1. Nagios
Nagios is an exceptional server monitoring tool due to its alerting system, flexibility, and scalability. Real-time tracking of server uptime, network performance, and resource utilization is one of the benefits it offers to administrators.
What differentiates Nagios is its modular architecture and the thousands of plugins that broaden its applicability in various environments. Instant notifications about server problems are sent, which allows for quick troubleshooting.
Its open-source attributes allow customization to fit various infrastructures, from small to large enterprise networks. For its reliability and community support, Nagios delivers the most comprehensive and detailed insights into server health compared to other tools on the market.
| Feature | Details |
|---|---|
| Tool Name | Nagios |
| Type | Open-source Server & Network Monitoring |
| Platform Supported | Windows, Linux, Unix |
| Key Functionality | Monitors server uptime, network performance, and resource usage |
| Alerting | Real-time alerts via email, SMS, or custom notification methods |
| Scalability | Suitable for small to large infrastructures |
| Unique Feature | Highly customizable with thousands of plugins for various environments |
| User Requirement | Minimal KYC – registration only required for official downloads or support |
| Ideal For | IT administrators, enterprises, and businesses needing proactive monitoring |
| Cost | Free (Open-source) with optional paid support plans |
2. Zabbix
Zabbix stands out as an exceptional option for server monitoring due to its extensive, integrated, and real-time network, server, and cloud instance tracking capabilities.
One of Zabbix’s singular traits is the ability to collect and visualize performance metrics systematically.

Users can monitor CPU, memory, and disk usage in real time and pinpoint usage metrics at any specified time interval via the dashboards. Zabbix uses automated alerts in conjunction with predictive monitoring, which allows adverse performance situations to be dealt with before they happen.
Zabbix is also open-source, which increases customization, and, for all types of organizations, it is a good and inexpensive solution.
As such, it becomes one of the most trusted applications and one of the most advanced analytical tools for IT professionals, which enables optimized and uninterrupted server functioning.
| Feature | Details |
|---|---|
| Tool Name | Zabbix |
| Type | Open-source Server & Network Monitoring |
| Platform Supported | Windows, Linux, Unix |
| Key Functionality | Real-time monitoring of servers, networks, and applications |
| Alerting | Automated notifications via email, SMS, or custom scripts |
| Scalability | Highly scalable for small to enterprise-level infrastructures |
| Unique Feature | Advanced visualization dashboards and predictive monitoring |
| User Requirement | Minimal KYC – only basic registration for official downloads or support |
| Ideal For | IT teams, network administrators, and enterprises needing proactive monitoring |
| Cost | Free (Open-source) with optional enterprise support plans |
3. Datadog
One of the best tools for monitoring servers is Datadog, thanks to its combination of real-time monitoring and advanced cloud-based performance analytics.
Unified dashboards offer deep visibility into servers, applications, and infrastructure. Uniquely, Datadog provides subscription users with AI-driven anomaly detection, automatically identifying unusual patterns to prevent downtime.
It effortlessly integrates with hundreds of tools and services to help companies monitor hybrid and multi-cloud environments.
With customizable dashboards, automated alerts, and comprehensive logs, Datadog empowers IT teams to optimize performance, guarantee uptime, and enable uninterrupted servers in sophisticated digital ecosystems.
| Feature | Details |
|---|---|
| Tool Name | Datadog |
| Type | Cloud-based Server & Infrastructure Monitoring |
| Platform Supported | Windows, Linux, macOS, Cloud environments |
| Key Functionality | Monitors server performance, applications, and network in real time |
| Alerting | AI-driven alerts and notifications via email, Slack, or webhook |
| Scalability | Highly scalable for small to enterprise-level infrastructures |
| Unique Feature | Unified dashboard with AI anomaly detection and multi-platform integration |
| User Requirement | Minimal KYC – simple registration required for account creation |
| Ideal For | IT teams, DevOps engineers, and enterprises needing full-stack observability |
| Cost | Paid plans with free trial available |
4. Prometheus
Prometheus stands out as one of the finest server monitoring tools, thanks to its robust open-source architecture and outstanding metric collection capabilities.
Architected for both reliability and scalability, it collects time-series data from servers and applications and performs real-time analytics with alerting capabilities.
One of its most powerful features is the Prometheus Query Language (PromQL), which lets users dive into and draw specific conclusions from intricate data sets. Prometheus is self-sufficient and keeps data locally, continuing to monitor even during network outages.
Prometheus’s effortless compatibility with modern systems, such as Kubernetes, provides it with the necessary attributes of reliability, outstanding performance, and comprehensive visibility, which is the reason it is the most preferred monitoring tool for cloud-native servers.
| Feature | Details |
|---|---|
| Tool Name | Prometheus |
| Type | Open-source Server & System Monitoring |
| Platform Supported | Linux, Windows (via exporters), Cloud environments |
| Key Functionality | Collects time-series metrics, monitors server performance and uptime |
| Alerting | Customizable alerts via Alertmanager and integrations with email/Slack |
| Scalability | Highly scalable for large infrastructures and cloud-native environments |
| Unique Feature | Powerful PromQL query language for advanced metric analysis |
| User Requirement | Minimal KYC – only basic registration for official resources if needed |
| Ideal For | DevOps teams, cloud-native infrastructures, and IT administrators |
| Cost | Free (Open-source) with community support |
5. Icinga
Icinga is one of the best tools to monitor servers because of its modern and flexible monitoring framework which helps in precise performance tracking.
Although being a fork of Nagios, its powerful web interface and advanced API integration make Icinga easy to manage complex IT infrastructures.
The real-time monitoring engine which provides instant alerts and detailed performance reports is one of Icinga’s most unique features. Icinga’s distributed monitoring functionality also lets users manage several servers and data centers from a single console.
Icinga’s customizable plugins, automation features, and distributed monitoring functionality make it a reliable tool for performance and quick issue detection.
| Feature | Details |
|---|---|
| Tool Name | Icinga |
| Type | Open-source Server & Network Monitoring |
| Platform Supported | Windows, Linux, Unix |
| Key Functionality | Monitors server health, network devices, and performance metrics |
| Alerting | Real-time alerts via email, SMS, or custom notifications |
| Scalability | Suitable for small to large distributed infrastructures |
| Unique Feature | Modern web interface with advanced API integrations |
| User Requirement | Minimal KYC – only basic registration needed for official downloads/support |
| Ideal For | IT administrators, enterprises, and teams managing complex networks |
| Cost | Free (Open-source) with optional paid support plans |
6. Checkmk
Checkmk is one of the best tools for server monitoring because it combines simplicity, scalability, and automation on a single platform.
It provides a user-friendly way to gain insights into the performance of servers, network devices, and applications. It sets itself apart through its intelligent auto-discovery capability, which identifies and configures new systems without requiring administrative input.
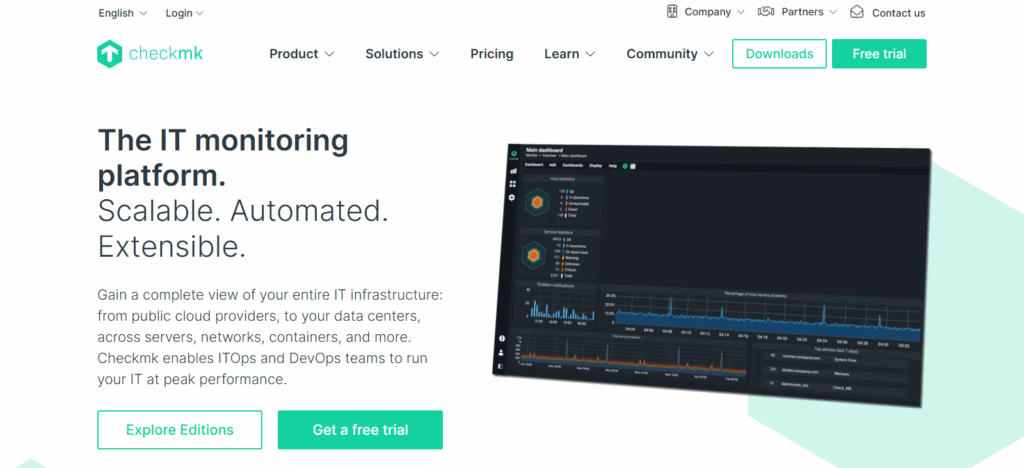
This is a powerful time-saver. The ability to provide agent-based and agentless monitoring offers greater versatility.
Checkmk’s proactive issue management, facilitated by configurable dashboards, predictive notifications, and low resource consumption shows performance reliability, consistent performance, and resource-efficient performance. It is perfectly suited to modern IT infrastructure and enterprises due to its hybrid monitoring capabilities.
| Feature | Details |
|---|---|
| Tool Name | Checkmk |
| Type | Open-source Server & Infrastructure Monitoring |
| Platform Supported | Windows, Linux, Unix, Cloud environments |
| Key Functionality | Monitors servers, networks, applications, and cloud infrastructure |
| Alerting | Automated alerts via email, SMS, or webhook |
| Scalability | Highly scalable for small to enterprise-level environments |
| Unique Feature | Smart auto-discovery of systems and minimal resource usage |
| User Requirement | Minimal KYC – only basic registration for official downloads/support |
| Ideal For | IT teams, enterprises, and administrators managing complex infrastructures |
| Cost | Free (Open-source) with optional enterprise features |
7. Sensu
Sensu offers a powerful way to monitor servers, providing a dynamic, event-driven approach to infrastructure and application monitoring. In contrast to other monitoring systems, Flexibility and automation define Sistemas’ design where users are able to design their own custom workflows for their operational needs.
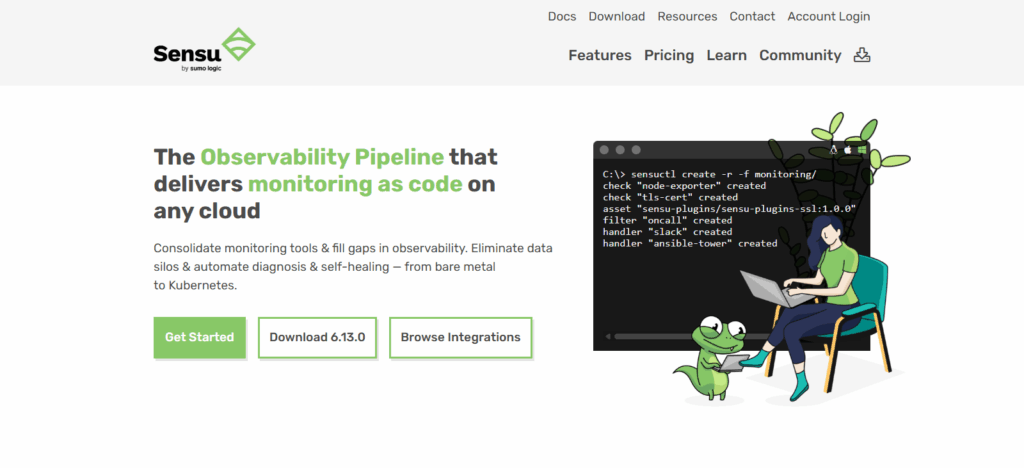
Sensu also integrates with modern DevOps tools and cloud environments, offering combined visibility over hybrid infrastructures, one of its principal advantages. Sensu works with real-time processing of events guaranteeing immediate identification and response to performance shortcomings.
For advanced and adaptive server monitoring in changing IT environments, Sensu provides intelligent monitoring with powerful APIs, other scalable infrastructure, and compatibility with Kubernetes and containerized systems.
| Feature | Details |
|---|---|
| Tool Name | Sensu |
| Type | Open-source Event-Driven Server & Infrastructure Monitoring |
| Platform Supported | Windows, Linux, Cloud environments |
| Key Functionality | Monitors servers, applications, and infrastructure with real-time events |
| Alerting | Automated alerts via email, Slack, or webhook |
| Scalability | Highly scalable for dynamic and hybrid infrastructures |
| Unique Feature | Event-driven monitoring with flexible automation and workflow integration |
| User Requirement | Minimal KYC – only basic registration for official downloads or support |
| Ideal For | DevOps teams, IT administrators, and organizations managing complex systems |
| Cost | Free (Open-source) with optional paid support |
8. Better Stack
Better Stack is an efficient tool for server monitoring thanks to its integration of uptime monitoring, incident management, and log analysis.
The platform’s optical dashboards and real-time collaboration options are game changers, speeding up teams’ responses to service outages.

Better Stack provides real-time alerts via Slack and email, and detailed, automated, and performance-oriented status updates for uptime reports.
Better Stack is built for modern teams and integrates effortlessly with existing server management tools, offering transparency and ease of automated server management at scale.
| Feature | Details |
|---|---|
| Tool Name | Better Stack |
| Type | Cloud-based Server & Uptime Monitoring |
| Platform Supported | Windows, Linux, macOS, Cloud environments |
| Key Functionality | Monitors server uptime, incidents, and performance in real-time |
| Alerting | Instant alerts via email, Slack, SMS, or webhooks |
| Scalability | Scalable for small teams to enterprise infrastructures |
| Unique Feature | Combines uptime monitoring, incident management, and collaboration tools |
| User Requirement | Minimal KYC – simple account registration for usage |
| Ideal For | DevOps teams, IT teams, and businesses needing easy-to-use monitoring |
| Cost | Paid plans with free trial available |
9. New Relic
New Relic is an excellent option for monitoring servers due to its full-stack observability and unparalleled level of detail on application and infrastructure performance.
Its unified telemetry system is one-of-a-kind in its ability to collect real-time data streams from servers, containers, and cloud services.
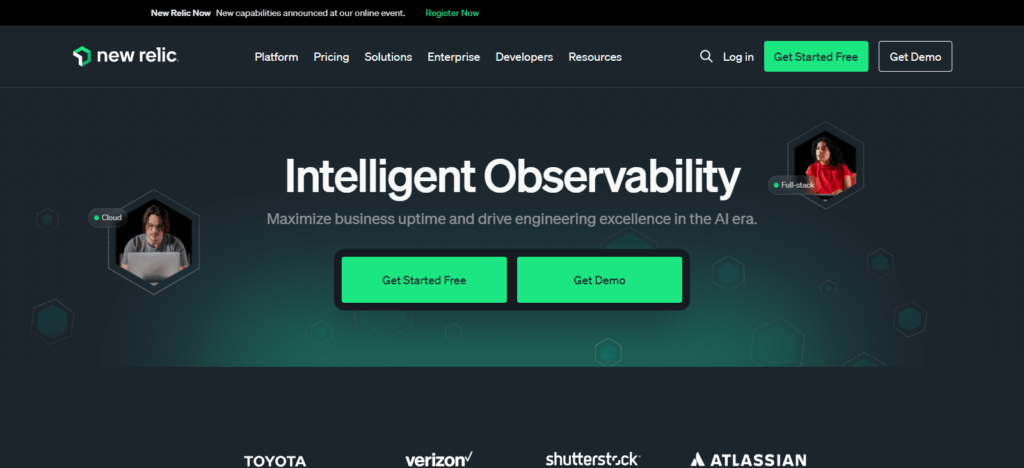
It provides visualization and detailed analytics, and detects performance issues through AI alerts. This enables quick problem resolution, optimizing resource consumption, minimizing downtime, and improving user satisfaction.
The ability to integrate with other enterprise systems, coupled with customizable dashboards, supports complex system monitoring and assisted analytics for effective reliability management.
| Feature | Details |
|---|---|
| Tool Name | New Relic |
| Type | Cloud-based Full-Stack Server & Application Monitoring |
| Platform Supported | Windows, Linux, macOS, Cloud environments |
| Key Functionality | Monitors server performance, applications, and infrastructure in real time |
| Alerting | AI-driven alerts and notifications via email, Slack, or webhook |
| Scalability | Highly scalable for small teams to large enterprise infrastructures |
| Unique Feature | Unified telemetry platform with AI-based anomaly detection |
| User Requirement | Minimal KYC – simple registration required for account setup |
| Ideal For | IT teams, DevOps engineers, and enterprises needing full-stack observability |
| Cost | Paid plans with free trial available |
10. Site24x7
Site24x7 stands out as one of the finest tools for server monitoring due to its all-inclusive analysis of a server’s health, performance, as well as uptime, all within one easy to use, cloud based solution.
Best of all, Site24x7 boasts the capacity of monitoring Windows and Linux servers alongside cloud instances from one single dashboard.
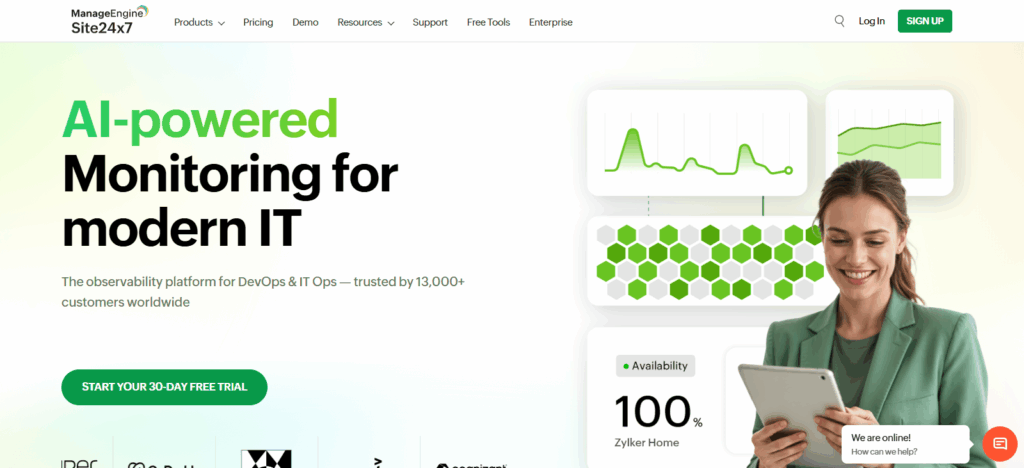
For your peace of mind, Site24x7’s predictive issue identification AI anomaly detection, performance analysis, and issue detection tools provides you with proactive assistance.
Site24x7 also meticulously reports server performance through monitoring CPU, memory, and disc. For businesses needing dependable, continuous, automated server oversight, Site24x7’s, rapid expansion, cloud storage, and mobile integration makes it a perfect candidate.
| Feature | Details |
|---|---|
| Tool Name | Site24x7 |
| Type | Cloud-based Server & Infrastructure Monitoring |
| Platform Supported | Windows, Linux, macOS, Cloud environments |
| Key Functionality | Monitors server uptime, performance, and network health in real-time |
| Alerting | Real-time alerts via email, SMS, or integrations with collaboration tools |
| Scalability | Scalable for small businesses to large enterprises |
| Unique Feature | Multi-platform monitoring with AI-powered anomaly detection |
| User Requirement | Minimal KYC – simple registration for account creation |
| Ideal For | IT teams, enterprises, and organizations needing proactive server monitoring |
| Cost | Paid plans with free trial available |
Conclusion
To summarize, selecting an appropriate server monitoring tool is crucial to maintaining the performance, uptime, and dependability of your IT assets.
Nagios, Zabbix, Datadog, Prometheus, Icinga, Checkmk, Sensu, Better Stack, New Relic, and Site24x7 provide an array of distinct functionalities for different organizations–from instant warning systems, and automated processes, to cloud services and analytics.
These systems allow organizations to identify and resolve problems to resource and operational optimization. A server monitoring system increases operational efficiency and user satisfaction while reducing the probability of unplanned outages.
FAQ
What is a server monitoring tool?
A server monitoring tool tracks the health, performance, and uptime of servers, providing alerts and analytics to prevent downtime and optimize resources.
Why is server monitoring important?
It ensures reliability, detects performance issues early, optimizes resource usage, and helps maintain uninterrupted services for users.
Can these tools monitor cloud servers?
Yes, most modern tools like Datadog, Prometheus, New Relic, and Site24x7 support both on-premises and cloud server monitoring.
Are these tools suitable for small businesses?
Yes, tools like Zabbix, Better Stack, and Site24x7 are scalable and cost-effective, making them ideal for small to large businesses.
Do these tools provide alerts for server issues?
Yes, all these tools offer real-time alerts via email, SMS, or collaboration platforms to ensure quick response.